This chapter of the e-book provides information on household and individual surveys conducted in Guinea to inform WARFP-GN. In the three target communities of WARFP-GN (Matakang, Bongolon and Koukoudé), two sets of survey data were collected and analyzed to determine the baseline conditions. Implementation of this exercise followed from Recommendation #1 from the community-led fisheries management and microfinance program in Senegal and Cabo Verde (Chapter 1), where it was argued that collection of micro-level data and their statistical analysis is essential for determining to what extent community interventions achieved their objectives. This activity was co-financed with RAFIP and WARFP-GN and in collaboration with National Institute of Statistics of Guinea (INS). The report prepared by INS detailed the survey methodology employed and data collection process followed for this activity. Using the survey data, WARFP-GN produced a study that described the baseline situation of the communities prior to the introduction of the community management system envisaged under WARFP-GN. A link to the full report, whose summary is presented in this chapter, is available here.
Two sets of survey work were implemented in the three target fishing communities of WARFP-GN: Matakang, Bongolong, and Koukoudé.
LSMS2018-FISH.This household survey is linked to the World Bank project “Regional Program to Harmonize and Modernize Living Conditions Surveys,” in which the Living Standards Measurement Study (LSMS) was implemented in Guinea and the West African Economic and Monetary Union (WAEMU) countries. While fisheries-specific information had not been collected in previous LSMS surveys of these countries, a short questionnaire for a fisheries module was developed for this LSMS and successfully inserted. Using the same questionnaire as the national LSMS survey for Guinea (including the fisheries module), households in the three fishing communities of WARFP-GN were surveyed. Additional sampling for the three communities was necessary as the random sampling process in the national LSMS did not result in the inclusion of the corresponding regions. Even if the regions had been included in the national sample, oversampling would have been necessary because coastal residents represent a small proportion in the national population. It is important to note that, since the national LSMS project is still ongoing and the final data are not yet available, the oversampling LSMS data from the three fishing communities used in the analysis presented here are considered as preliminary.
FISH2018. In addition to the LSMS household survey, individuals working in the fisheries sector and landed fish catches were surveyed in the three communities. Separate sampling was made for (a) fishing boat owners, (b) fishmongers, (c) fish smokers, and (d) fish landings.
The conventional belief is that the fishing industry, and fishers’ income, become more resilient to external shocks if the targeted and landed fish species are diversified. In addition, industry resilience is usually correlated to the size and type of fishing boats. A sturdier boat, in terms of the construction material and/or size, may be able to withstand harsher weather conditions. Engine-powered boats allow fishers to cover wider spatial areas in search of fish, and may save the boat and crew in the event of a sudden weather change. Such mobility enhances fishers’ resilience in light of fish stocks shifting in response to ocean condition changes, including due to global climate change.
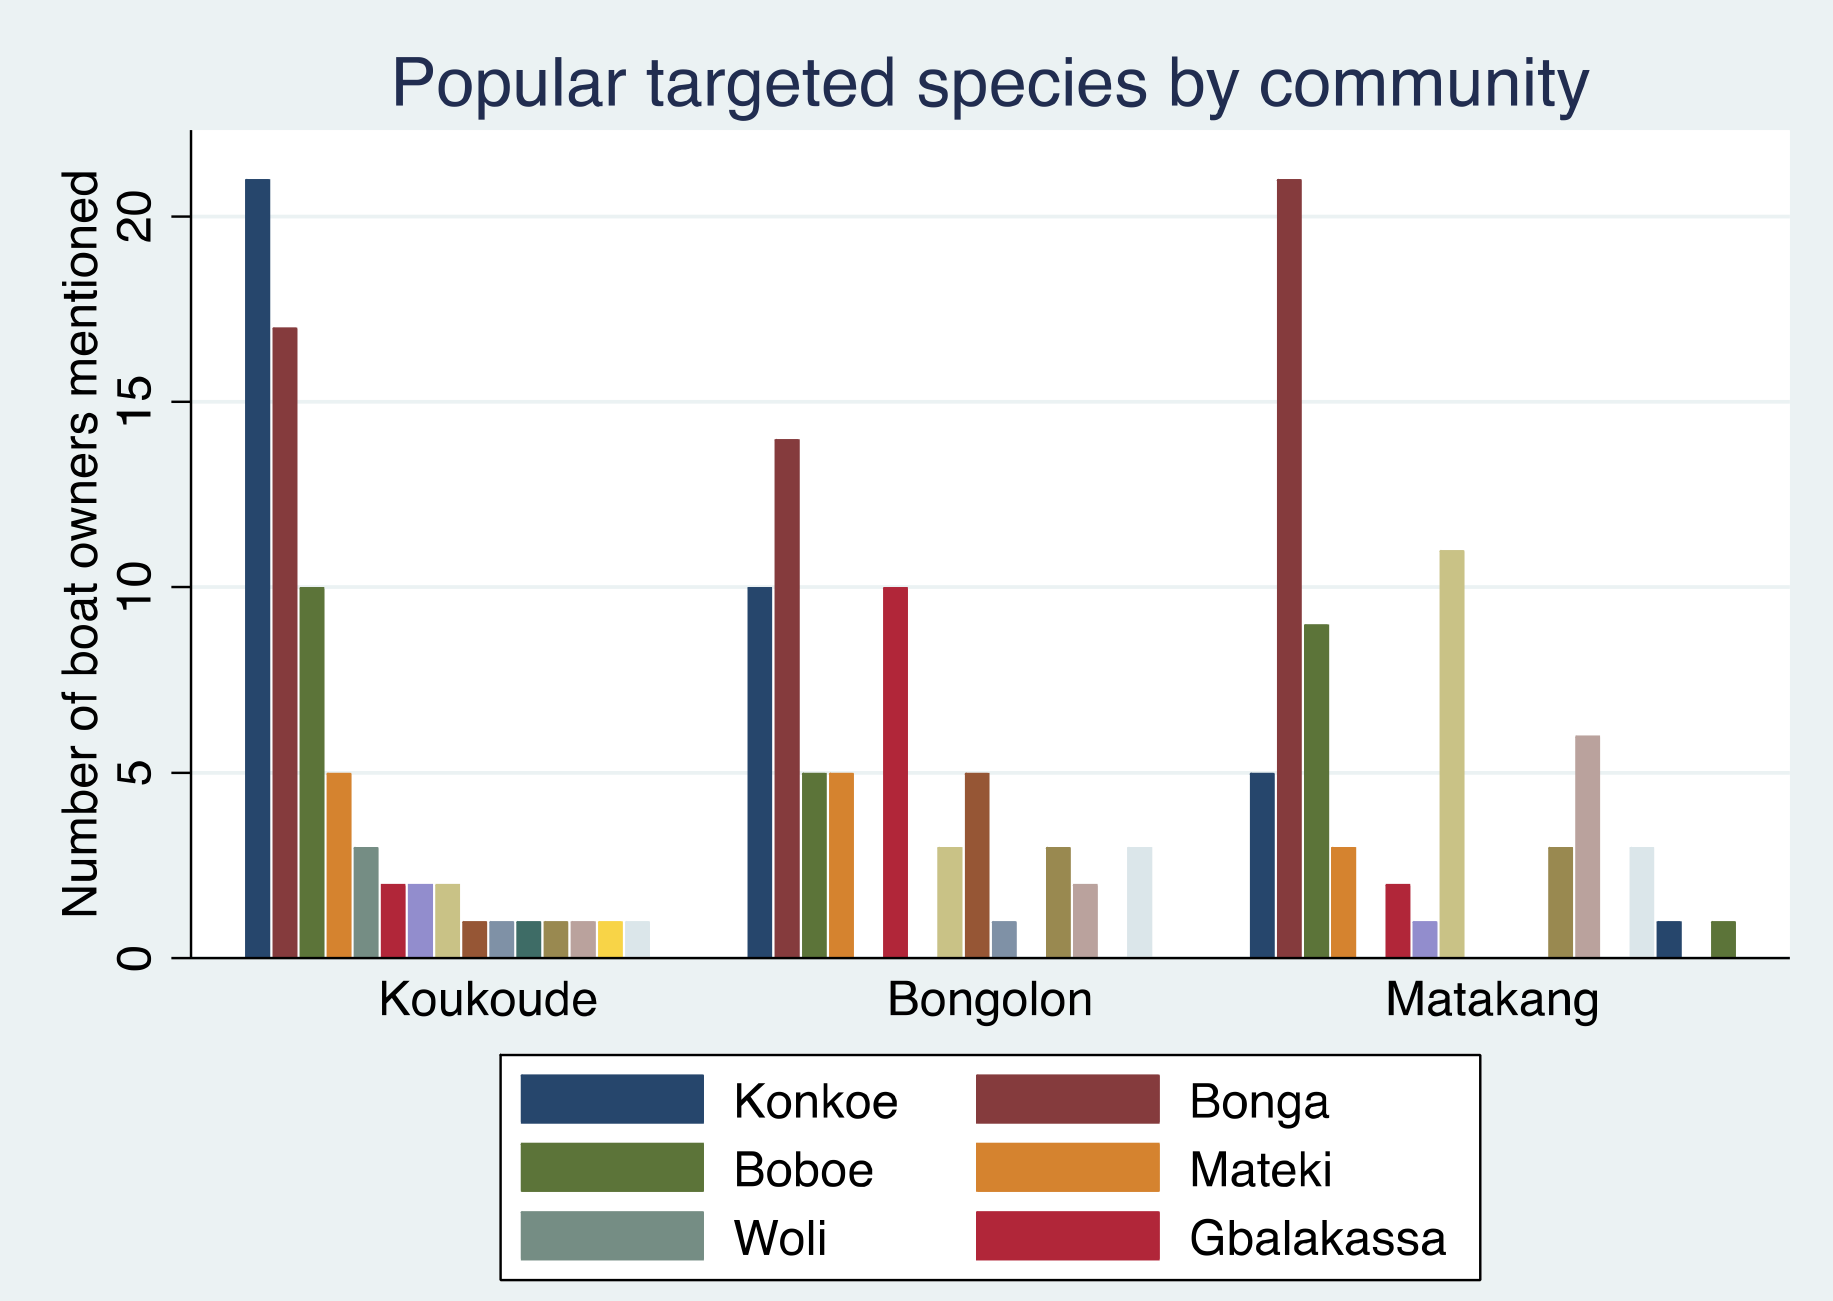
Motivated by these hypotheses, an analysis of survey data for individuals working in the fisheries sector was conducted. The FISH2018 survey asked fishing boat owners in the surveyed communities if they caught any of the 58 species specified in the list during the past year. The survey observed that 23 species among the 58 were actually caught in these communities. Across all three communities, the four most popular targeted species were bonga (ethmalose/bonga shad), konkoe (machoiron/rough-head sea catfish), boboe (bobo croaker), and sosoe kondounke (cassava croaker).
The fish species caught vary substantially across the three communities (Figure 5.1). A statistical analysis confirms that Koukoudé has the least diversity while Bongolon has the highest, though the difference is small.
Figure 5.1. Popular targeted species by community
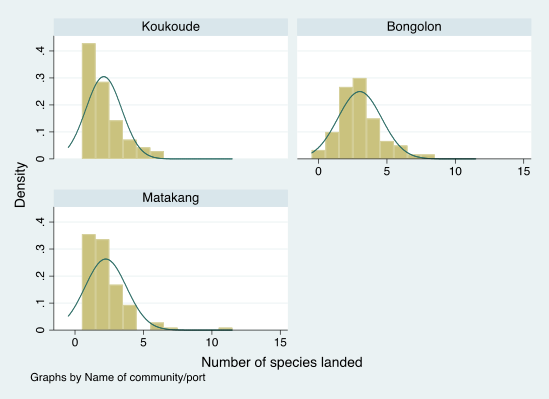
At fish landing sites, the survey asked how many species were included in sampled catches. The majority of captains landed only a handful of species: 31.2 percent of captains landed just one species, and 92.0 percent of captains landed four or fewer species. Looking across the three communities, Bongolon captains landed a larger number of species, with most captains landing two to three species (Figure 5.2).
Figure 5.2. Distribution of number of species landed by community
Part of the reason for such differences in targeted and landed species diversity is the fishing gear and/or boats being used. The analysis of survey data related to fishing boats revealed the following:
Overall, the FISH2018 survey data show that fish production is more diversified in Bongolon. This may be an indication of greater resilience of Bongolon’s local fisheries to shocks in the ecosystem, as the conventional belief suggests. However, at this point the hypothesis is not confirmed. Nonetheless, the findings likely have implications for the design of fisheries co-management pursued in WARFP-GN.
The LSMS2018-FISH data were used to analyze the living standards and food security of the residents in the three communities. The survey asked about household expenditures on food and other items, as well as subjective questions about household food security. This analysis is based on the following two sets of variables.
Table 5.1 summarizes the variables used in the analysis. (Note that “HH” denotes household.) The analysis presented here suffers from the small sample size of the LSMS2018-FISH dataset, which was partly driven by the small budget for the survey: altogether 84 observations are included, with 36 from Koukoudé and 24 each from Bongolon and Matakang. Looking across the demographic variables used in the analysis, the average household size was largest in Bongolon (5.7 people), followed by Matakang (4.9) and Koukoudé (3.2). On average, the households were older in Matakang (with an average age of 43 years) and Bongolon (41) than in Koukoudé (36). Overall, 40 percent of the households in the sample had at least one household member engaged in fishing (referred to as “fishing household” hereafter). The proportion of fishing households is highest in Matakang (67 percent), followed by Bongolon (46 percent) and Koukoudé (17 percent). Other variables are discussed in more detail below.
Table 5.1. Descriptive statistics of selected variables from the LSMS2018-FISH survey
| Total | Koukoudé | Bongolon | Matakang | |
| Variables | Mean (SD) | Mean (SD) | Mean (SD) | Mean (SD) |
| Food insecurity variables (0=no, 1=yes) | ||||
|
0.679 (0.470) |
0.556 (0.504) |
0.875 (0.338) |
0.667 (0.482) |
|
0.524 (0.502) |
0.444 (0.504) |
0.875 (0.338) |
0.292 (0.464) |
|
0.690 (0.465) |
0.556 (0.504) |
0.792 (0.415) |
0.792 (0.415) |
|
0.506 (0.503) |
0.333 (0.478) |
0.833 (0.381) |
0.435 (0.507) |
|
0.631 (0.485) |
0.500 (0.507) |
0.833 (0.381) |
0.625 (0.495) |
|
0.369 (0.485) |
0.306 (0.467) |
0.750 (0.442) |
0.083 (0.282) |
|
0.333 (0.474) |
0.250 (0.439) |
0.708 (0.464) |
0.083 (0.282) |
|
0.286 (0.454) |
0.167 (0.378) |
0.625 (0.495) |
0.125 (0.338) |
| Demographic variables | ||||
|
4.405 (2.602) |
3.194 (1.737) |
5.708 (3.581) |
4.917 (1.640) |
|
3.254 (1.878) |
2.402 (1.209) |
4.127 (2.603) |
3.658 (1.275) |
|
2.614 (1.146) |
2.069 (0.799) |
3.180 (1.530) |
2.865 (0.753) |
|
39.4 (11.3) |
35.7 (10.1) |
41.3 (12.8) |
43.0 (10.3) |
(0=none ~ 4=post-secondary) |
0.714 (1.025) |
0.611 (0.934) |
0.875 (1.076) |
0.708 (1.122) |
|
0.393 (0.491) |
0.167 (0.378) |
0.458 (0.509) |
0.667 (0.482) |
| Expenditure variables (million Guinean franc) | ||||
|
1. HH annual food expenditure |
24.6 (22.0) |
23.6 (19.1) |
33.5 (30.8) |
17.0 (9.7) |
|
2. HH annual total expenditure |
45.2 (31.4) |
44.7 (30.4) |
57.5 (39.5) |
33.8 (17.3) |
|
3. HH annual Engel’s coefficient [(2)/(1)] |
0.545 (0.190) |
0.529 (0.179) |
0.605 (0.204) |
0.507 (0.186) |
|
Sample size (N) |
84 |
36 |
24 |
24 |
A series of statistical analyses to explain the variations in average household expenditures and subjective food security across communities revealed the following tendencies:
Next, the data were used to analyze the variations in these variables at the household level. The results of the regression analysis are summarized as follow:
A single definition of co-management does not exist. Nevertheless, one common feature is the involvement of some level of coordination among the resource users, who otherwise can be, and have been, operating independently. Based mostly on FISH2018 survey data on fishing boat owners, conditions for successful fisheries co-management systems in the three communities were investigated.
1. Non-fishing occupations among fishing households
The survey asked what secondary occupation the boat owners were engaged in. In all three communities, a fishing household that only did fishing was relatively a minority; about 40 percent of fishing households in Matakang and Bongolon were full-time while less than 20 percent were so in Koukoudé. There were many fishing households that engaged in farming and other occupations; only a few in Matakang were engaged in livestock production.
This prevalence of secondary occupations can be either an advantage or disadvantage for fishery co-management. It is advantageous because the members of fishing co-management need not be privileged solely based on fishing, but from a combined benefit from all occupations. For example, cutting back the fishing days to curtail overharvesting allows fishing households to spend more time in farming, supplementing the loss from fishing in the short run while the fish stock recovers. On the other hand, the presence of an alternative occupation could reduce the relative importance of fishing as an income-earning activity, thereby diminishing the incentive among the fishing households to co-manage the fishing. For this reason, it will be important to understand the relative importance of fishing and other occupational activities among the fishing households.
2. Financial ties and co-management membership
The FISH2018 survey included a set of questions that are indicative of the existence of financial ties between fishers and fish buyers. The responses to these questions revealed the sources of finance that fishing households received and the buyers to whom they sold their catch. A majority or close to majority of fishing households financed their boats and equipment on their own. However, Bongolon is unique in that close to 50 percent of its fishing households were financed by fishmongers—the highest among the three communities. Matakang follows closely with approximately 30 percent of its fishing households financed by fishmongers. With this in mind, an interesting pattern emerges on the sales side. In Bongolon, a dominant share of sales went to fishmongers as opposed to the first-come, first-served situation in Koukoudé. The sales destinations in Matakang were more evenly spread, but the destination with the highest frequency is fishmonger as well. These results suggest that some sort of debt-and-sales relationship existed.
In the context of fishery co-management, this observation has two implications. First, fishing households that are in a debt-for-sale relationship may be hindered from pursuing other business opportunities (such as selling to buyers who offer higher prices). Second, the fishmongers and other actors in a similar financial relationship with fishing households need to be part of the co-management arrangement. Financers will have an incentive to support improved fishery management because the performance of the fishery directly relates to their loans being repaid, in addition to improving the supply of fish to financiers’ fishmonger businesses.
3. Cohesiveness of fishing households in community
Non-economic factors such as disputes among fishing households in a community matter for the success of co-management. In all three communities cooperative-like associations were present with varying degrees of activeness and success. The FISH2018 survey asked what incidents these associations helped resolve. There are considerable differences in the nature of incidents across the three communities. In Koukoudé, disputes among members dominate the incidents, while Matakang experienced both member and outsider disputes equally. Bongolon, on the other hand, had very few incidents of any kind that required their associations to help resolve. This is not surprising as Bongolon’s associations are considered to be well functioning. Co-management groups in Matakang and Koukoudé will need to be aware of the nature of member disputes so as not to let them undermine the co-management effort.
Overall, the activities related to survey data collection and analysis in Guinea led to the following conclusions.